Why Is My Conversion Rate Dropping While Traffic Stays Normal?

UptimeClick Operations
5 min read
The Diagnostic Rule of Steady Traffic
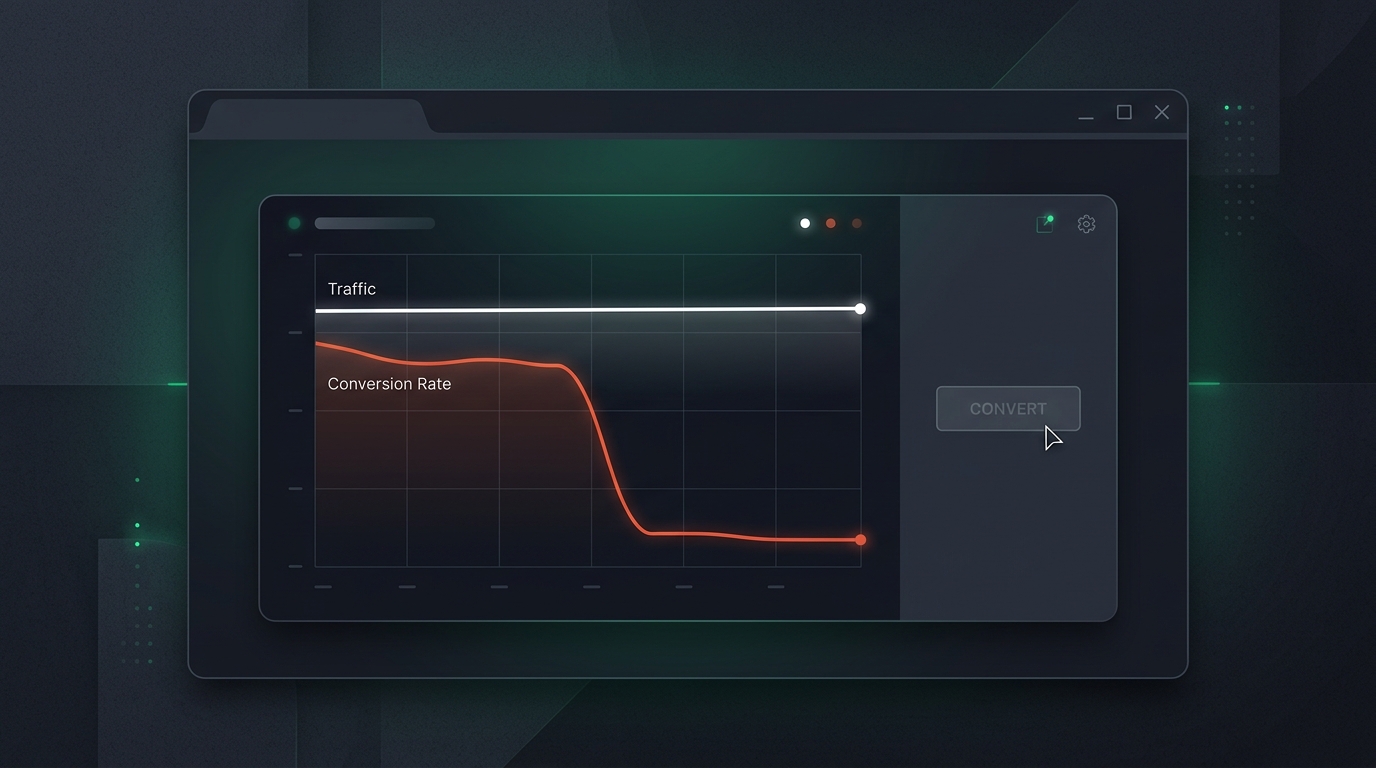
If your daily sessions and ad clicks match last week's benchmarks, but your orders suddenly plummeted by 40% or more, do not change your pricing or rewrite product descriptions. Sudden drops with steady traffic are almost never caused by sudden shifts in market demand.
Consumer intent does not evaporate overnight. When traffic volume remains unchanged while transactions disappear, a technical obstacle has entered the purchasing path.
Step 1: Isolate the Drop in GA4 (The 3 Critical Dimensions)
Before inspecting store code, open Google Analytics 4 and slice your conversion rate across three specific dimensions to identify the failure boundary:
- Device Category (Desktop vs. Mobile vs. Tablet): If mobile conversion is normal but desktop conversion fell to zero, the issue is an unhandled desktop script, a broken viewport layout, or a desktop mouse click conflict.
- Browser and Operating System: Compare Chrome, Safari, Edge, and Firefox. Modern browsers interpret JavaScript and CSS differently. A missing polyfill or an unescaped regex in a new bundle can crash Safari while working fine in Chrome.
- Funnel Step Abandonment:Look at your checkout funnel (View Item > Add to Cart > Begin Checkout > Purchase). Identify the exact transition where the drop occurs. If users view items but Add to Cart actions drop to zero, the button itself is broken. If Begin Checkout is healthy but Purchases drop, payment gateway communication has failed.
The 4 Invisible Causes of Sudden Conversion Collapses
1. Silent Client-Side JavaScript Exceptions
Modern stores rely on extensive client-side JavaScript. Themes use hydration to turn static HTML into interactive elements. If a tag manager snippet, a currency converter, or a review widget throws an uncaught TypeError during page initialization, browser script execution terminates immediately.
The product image loads, the price appears, and the page looks visually complete. However, the event listener attached to the “Add to Cart” or “Place Order” button is never mounted. Shoppers click the button repeatedly, receive zero visual response, and abandon the tab without submitting a support ticket.
2. Transparent DOM Overlays and High Z-Index Collisions
Cookie consent management platforms (CMPs), live chat popups, and age verification modals frequently inject full-screen transparent wrappers into the DOM.
If a cookie banner is dismissed but fails to set pointer-events: none or fails to remove its backdrop element from the DOM, an invisible layer with z-index: 999999 remains sitting on top of the entire screen. Shoppers can see the checkout button, but their mouse clicks hit the invisible backdrop rather than the button element below.
3. Third-Party App Updates Deployed Without Notice
Even if your internal engineering team has not deployed new code in weeks, third-party apps update continuously. Shopify apps, WooCommerce plugins, and external tag manager containers run remote bundles hosted on external CDNs.
An automated release from a shipping calculator, tax calculation service, or review platform can introduce a breaking syntax error that halts your checkout pipeline. Because you did not touch the store, you assume everything is functional while conversions drain away.
4. Payment Gateway SDK and Webhook Latency
Payment providers like Stripe, PayPal, and Klarna dynamically load client-side iframes to securely capture card details. If an external payment CDN experiences localized DNS degradation or SSL certificate renewal delays, the payment input field fails to render.
Shoppers reach the final payment step but see an empty box or a perpetual loading spinner. Because the rest of the store loaded fast, your server health metrics remain completely green while no transactions can clear.
Why Traditional Uptime Monitors Report 100% Green
The most dangerous aspect of a technical conversion drop is that legacy monitoring tools will never notify you.
Traditional ping monitors send basic HTTP GET requests to your homepage or checkout URL. As long as your hosting server responds with an HTTP 200 OK header, the monitor marks the site as fully operational.
These tools never launch a headless browser, never download JavaScript assets, and never simulate real user interaction. Your server can have 100% uptime while every single customer on your store is physically unable to place an order.
How Synthetic Browser Testing Detects Conversion Killers
To catch revenue-killing bugs before your daily metrics expose the damage, automated synthetic monitoring is necessary.
Instead of relying on server pings, synthetic monitoring tools like UptimeClick deploy automated desktop Chromium browsers on a continuous schedule:
- The browser navigates to your live product and checkout pages like a real visitor.
- It executes the complete frontend JavaScript bundle and waits for DOM hydration to finish.
- It locates key action elements (Add to Cart, Proceed to Checkout, Place Order) and verifies they are visible, clickable, enabled, and unblocked by transparent overlays.
- If an actionability check fails, it captures a high-resolution screenshot and immediately sends an alert with visual evidence.
This proactive verification ensures that if a third-party app or GTM container breaks button clickability, your team is alerted in minutes rather than discovering the loss at the end of the day in your analytics reports.