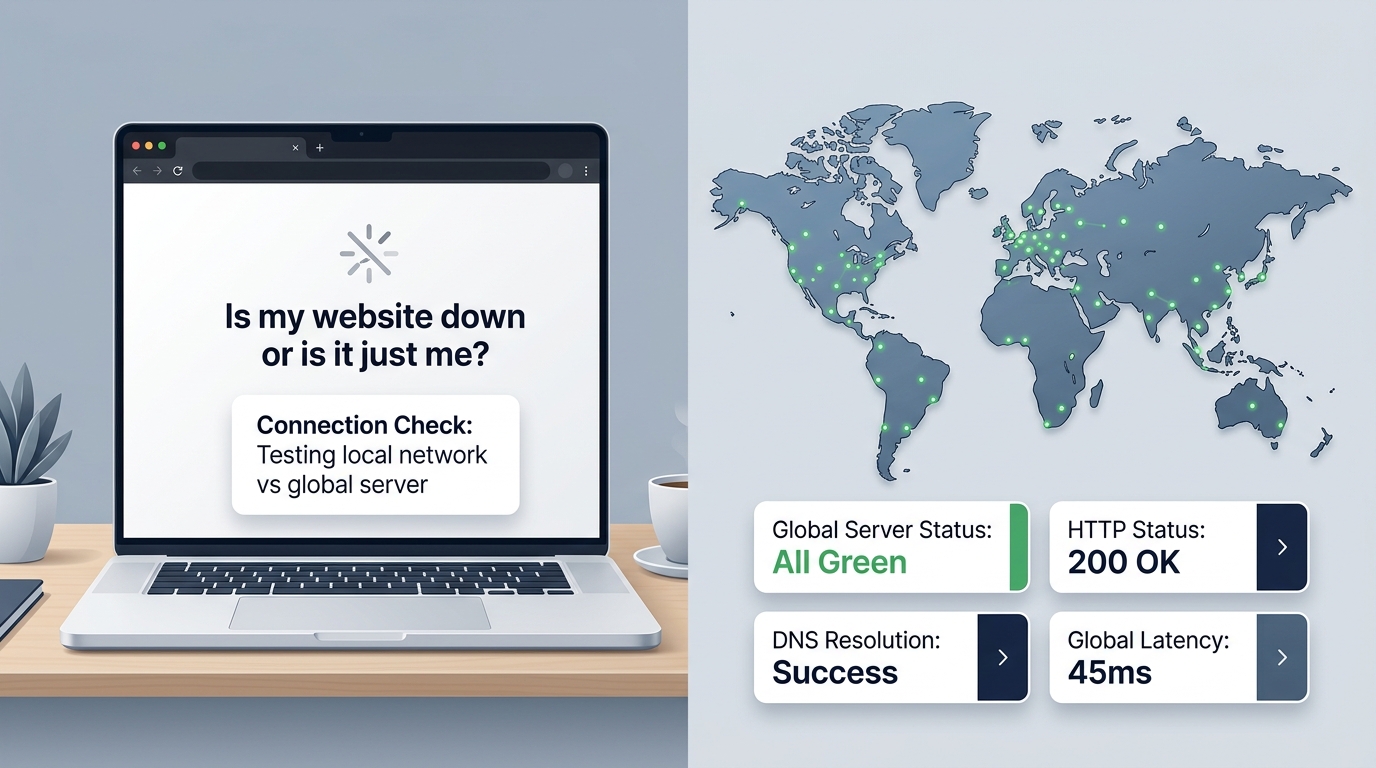
Is My Website Down or Just Me? How to Check, Diagnose, and Fix It

UptimeClick Operations
6 min read
The Universal Moment of Web Panic
You type your website URL into your browser address bar, hit Enter, and wait. The tab spins endlessly, followed by a blank screen or a dreaded browser alert: “This site can’t be reached” or “Server IP address could not be found”.
Your heart drops. Is your site completely offline for the entire world? Are visitors getting errors right now? Or is it simply a hiccup with your office Wi-Fi, DNS cache, or browser extensions?
Before you panic or make hasty changes to your server settings, use this systematic diagnostic framework to determine whether your website is truly down or if the issue is isolated to your local setup.
Want automated verification that your 'Place Order' button actually works?
Standard HTTP ping monitors only check server status codes and miss broken JavaScript hydration, invisible overlays, and disabled checkout buttons. UptimeClick runs real headless Chromium every 2 hours to verify that buttons like Place Order or Complete Purchase are physically actionable—alerting you immediately with error screenshots if a click fails.
Phase 1: The 60-Second “Is It Just Me?” Sanity Test
More than 40% of perceived website outages turn out to be local connection issues. Work through these three quick steps first:
- Switch from Wi-Fi to Mobile Cellular Data: Turn off Wi-Fi on your smartphone and load your website over 4G/5G. If your site opens smoothly on cellular data, your web server is online. Your local office router, ISP, or IP address might be temporarily blocked by your web firewall.
- Open an Incognito or Private Window: Browser extensions, ad blockers, and stale cached files frequently cause display errors. An Incognito window loads the page without your saved cookies or local browser extensions.
- Test a Known Major Website: Visit a global website like Google or Wikipedia. If those sites also fail or load sluggishly, your local internet gateway is the problem.
Phase 2: Verifying Global Accessibility
If your website still fails to load on cellular data and in Incognito mode, you must verify whether the outage is global or confined to a specific geographical region.
Use third-party global checking nodes. Online availability services query your domain from servers in Europe, North America, Asia, and Australia simultaneously:
- Global Failure: If servers across all continents report connection timeouts or HTTP 500/502/503 errors, your core web host or origin server is offline.
- Regional Failure: If your site is accessible in the US but unreachable in Europe, the issue typically stems from a Content Delivery Network (CDN) edge outage or regional DNS propagation delay.
Phase 3: Decoding the Browser Error Code
The error message displayed in your browser provides immediate clues about where the connection failed:
500 Internal Server Error
The web server is reachable, but an unhandled software crash occurred (such as a fatal PHP error, corrupted WordPress plugin, or database connection failure).
502 Bad Gateway / 503 Service Unavailable
Your edge proxy (Cloudflare, Nginx) cannot communicate with your backend application server. This frequently happens when server RAM or CPU limits are maxed out during traffic spikes.
DNS_PROBE_FINISHED_NXDOMAIN
The domain name cannot be resolved to an IP address. Check your domain registrar immediately to verify that your domain registration has not expired or that nameserver records were not altered.
SSL Certificate Warning / NET::ERR_CERT_COMMON_NAME_INVALID
Your website is accessible, but your HTTPS security certificate has expired or fails to match your custom domain. Browsers will block visitors with an aggressive security warning screen.
The Modern Blind Spot: When Your Site Is “Up” but Broken
Here is the biggest misconception among modern website owners: HTTP 200 OK does not mean your website is actually working.
Traditional uptime monitors check your site every few minutes by sending a lightweight ping to your homepage. If your server returns an HTTP 200 status code within 500ms, the monitor records 100% uptime and marks everything green.
However, modern websites run complex client-side code: contact forms, lead generators, booking calendars, and e-commerce checkout buttons. If an external JavaScript library crashes or an invisible overlay covers your buttons, visitors cannot interact with your site at all.
To your ping monitor, you have 99.9% uptime. To your visitors, your website is completely broken.
How to Prevent Outages Before Visitors Notice
Finding out your website is down from an angry customer or noticing a sudden drop in daily leads is the most expensive way to discover downtime. To safeguard your digital presence:
- Set Up Automated Renewal for Domains & SSL: Ensure your domain registrar and SSL certificates are configured for auto-renewal with verified billing cards.
- Keep Staging Environments for Updates: Never update themes, CMS cores, or plugins directly on a production server without testing.
- Deploy Synthetic Browser Monitoring: Go beyond simple ping checks. Use automated headless Chromium testing that navigates to your critical pages, clicks primary buttons, and alerts you with visual screenshot evidence the moment interactive elements fail.
Never Guess if Your Website Is Really Working
UptimeClick tests your web pages and critical buttons inside real desktop browsers round the clock. Receive instant screenshot alerts the moment your site or buttons fail.