How to Track Website Health in 2026: The Functional Audit Guide

UptimeClick Operations
5 min read
The Flawed Definition of Website Health
For over two decades, tracking website health meant answering a single binary question: Is the server up or down?
If a ping tool received an HTTP 200 OK header within three seconds, site reliability teams considered the website healthy. In 2026, that definition is dangerously obsolete.
Modern websites are no longer static collections of HTML documents served by a single Apache process. They are distributed client-side applications powered by React, Vue, edge workers, multi-CDN caching, and dozens of third-party SaaS widgets (tag managers, payment gateways, live chats, and fraud shields).
A web server can return a flawless 200 OK status code while unhandled JavaScript exceptions, expired API tokens, or CSS overlay bugs render critical purchase buttons completely unusable.
The 3 Pillars of Modern Website Health Tracking
To accurately evaluate and track website health, technical operators must monitor three distinct layers:
1. Infrastructure Availability (Server & Network Health)
Infrastructure tracking verifies the physical connection between client browsers and your hosting origin.
- DNS Resolution: Ensuring root records and CNAME lookups resolve under 50ms across global edge locations.
- SSL/TLS Certificate Validity: Monitoring intermediate certificate chains, cipher suite deprecation, and expiration dates before browsers display security warnings.
- HTTP Response Headers: Verifying status codes (200, 301, 404, 502) and ensuring edge servers correctly deliver compressed Brotli or Gzip payloads.
2. Performance Latency (Speed & Core Web Vitals)
Speed tracking ensures pages load fast enough to prevent bounce rate spikes.
- Time to First Byte (TTFB): The time required for the initial server byte to reach the user. High TTFB indicates database query bottlenecks or slow backend caching.
- Largest Contentful Paint (LCP): The time it takes for the primary above-the-fold content element to render on screen.
- Interaction to Next Paint (INP): Measuring client-side responsiveness when users click, tap, or press keys on the page.
3. Functional Integrity (Interactive & DOM Health)
This is the most critical and frequently neglected pillar: Does the website actually work when users interact with it?
- Button Actionability: Are primary call-to-action buttons (Add to Cart, Submit Form, Proceed to Checkout) physically clickable, or are they disabled by runtime script errors?
- Modal & Overlay Collisions: Have cookie consent banners or promotional popups injected transparent backdrops that absorb pointer events with high z-index values?
- Third-Party Script Stability: Are external analytics pixels or chat widgets blocking the browser's main thread and preventing form hydration?
The 2-Minute Website Health Audit Checklist
Run this quick health audit on your core conversion funnels before launching ad campaigns or seasonal promotions:
- Execute a Live Browser Console Check (F12): Open your product and checkout pages in an incognito window with DevTools open. Confirm there are zero red
Uncaught TypeErrororChunkLoadErrorlogs during initial render. - Audit Third-Party Script Weights: Filter the Network tab by JS. If third-party marketing tags account for more than 60% of total transfer size, your main thread is vulnerable to execution freezes on mobile devices.
- Inspect Critical Button Actionability: Right-click your main purchase button and inspect elements. Ensure no invisible wrapper has
pointer-events: autositting on top of the button coordinates. - Verify Multi-Step Funnel Persistence: Add an item to your cart, proceed to checkout, and verify that cart state persists across page transitions without requiring manual refreshes.
Why Ping Monitors Miss Functional Health Collapses
Traditional monitoring tools like Pingdom or basic uptime pingers only make simple HTTP GET requests. Because modern web frameworks return an HTML container shell with HTTP 200 status, traditional tools report 100% green health.
These monitors never launch a headless browser engine, never parse JavaScript bundles, and never simulate physical user interaction. Your server health dashboard can show five nines of uptime while your actual conversion rate drops to zero because an unhandled script broke the buy button.
Automated Synthetic Health Tracking with UptimeClick
To ensure true website health across all three pillars, modern engineering and e-commerce teams deploy automated synthetic browser testing.
Tools like UptimeClick launch real desktop Chromium browser instances on a continuous schedule:
- The browser navigates directly to your live URLs and executes the full client-side JavaScript bundle.
- It tracks response latency and monitors whether page hydration completes cleanly.
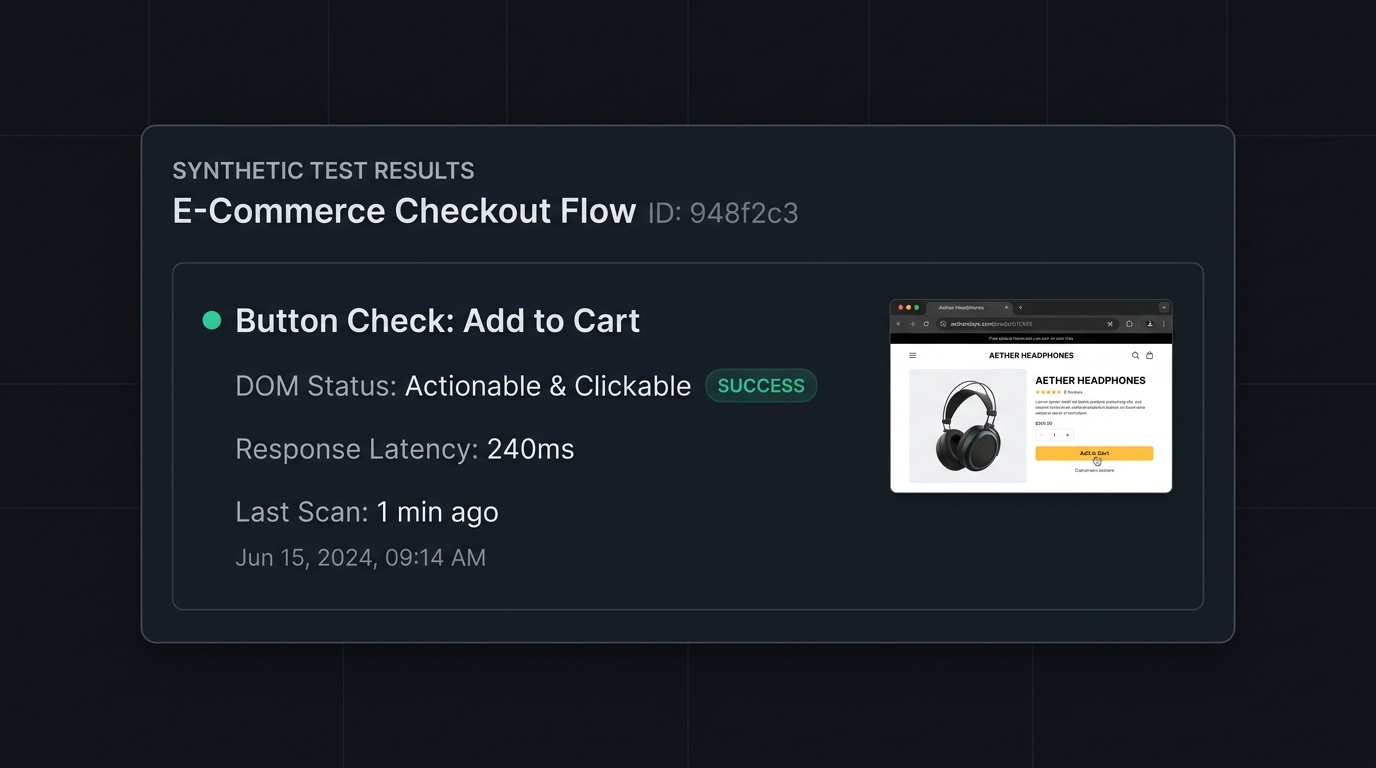
- It locates key action elements (Add to Cart, Checkout, Lead Forms) in the live DOM and validates physical actionability.
- If a button fails actionability checks, becomes unresponsive, or is blocked by an overlay, it captures a high-resolution screenshot and immediately sends an alert with visual evidence.
This functional tracking bridges the gap between server uptime and real customer experience, ensuring that when your dashboard says your website is healthy, it is actually generating revenue.